IIMS Journal of Management Science

 Search
Ricardo T. Calderon1, Amulya Gurtu2 and Michael A. Holly3
1 University of Wisconsin-Parkside, Kenosha, Wisconsin, United States
2 University of Kansas, Overland Park, Kansas, United States
3 University of Wisconsin0-Green Bay, Wisconsin, United States

Creative Commons Non Commercial CC BY-NC: This article is distributed under the terms of the Creative Commons Attribution-NonCommercial 4.0 License (http://www.creativecommons.org/licenses/by-nc/4.0/) which permits non-Commercial use, reproduction and distribution of the work without further permission provided the original work is attributed.
Corporate social responsibility (CSR) reporting is a strategy for communicating sustainability data to stakeholders. Sharing data with stakeholders is the key to the effectiveness and validity of CSR. However, the often-voluntary nature of CSR disclosure reporting results in perceived bias. Consequently, the relationship between CSR disclosure transparency and the sustainable character of a company remains unclear. The article suggests a methodology for evaluating corporate transparency through t-value analysis. The t-value analysis of CSR reports from Corporate Knights’ 2021 Global 100 Most Sustainable Corporations quantifies the total number of negative disclosures in a CSR report. This research shows a lack of correlation (p value = .805) between observable levels of transparency and third-party sustainability rankings amongst the sustainability elite of the corporate world.
Corporate social responsibility, CSR, transparency, environment, standards, regulation
Introduction
Sustainable products have growth rates nearly six times that of non-sustainable options (Kronthal-Sacco & Whelan, 2019), signalling a strong interest amongst consumers and stakeholder groups in evaluating the impact of corporate production and operation practices. Corporate social responsibility (CSR) is built on the stakeholder theory and has become an influential model for evaluating the role of modern corporations. ‘Honesty’ is a corporate attribute, valued highly enough by consumers that they are willing to pay a premium for products and services rendered by such corporations (Nielsen, 2015; O’Connor & Meister, 2008). Consequently, corporations are compelled to communicate and display a virtue of trustworthiness, genuine or otherwise, towards these stakeholder groups to capitalize on consumers’ moral concerns. In an attempt to allay these concerns, several independent agencies have introduced annual corporate sustainability rankings designed to demonstrate sustainable performance using data gathered from questionnaires (S&P Global, 2020), publicly available information (i.e., CSR reports) (Corporate Knights, 2020) and other forms of self-published data.
Large corporations’ annual sustainability reports communicate CSR data and summarize environmental and social initiatives and their impacts. KPMG International found that 96% of the G250 companies and 80% of the N100 reported sustainability data. As CSR reporting practices become common, efforts to legitimize the data increase. Over 50% of G250 and N100 companies pursue third-party assurance for CSR data (Threlfall et al., 2020). The Global Reporting Initiative (GRI) is the primary standard incorporated in over two-thirds of N100 and G250 companies (Threlfall et al., 2020).
Studies and observations suggest that CSR strategies are most effectively used as a risk management tool (Husted, 2005; Kytle & Ruggie, 2005). Research shows that strong CSR provides a competitive edge and is associated with higher returns, increased market value and greater customer loyalty (Burke & Logsdon, 1996; Chen et al., 2015; Gurtu et al., 2019; Loh et al., 2017; Lougee & Wallace, 2008; Orlitzky et al., 2003; Webley & More, 2003). However, CSR reporting is not without flaws. The biggest flaw in CSR reporting is that it is, in most cases, voluntary, and this can result in a corporation anecdotally espousing its trustworthiness without disclosing relevant data (Swift, 2001). The disclosure of CSR data has thus been criticized as ‘a la carte’ reporting, allowing corporations to choose the information that will best placate stakeholders (Shnayder et al., 2015; Timothy Coombs et al., 2013). Voluntary Disclosure Theory and Legitimacy Theory suggest that corporations should strive to reduce information asymmetries between themselves and their stakeholders (Deegan, 2002; Dye, 1985; Suchman, 1995; Verrecchia, 1983). The GRI and similar reporting standards aim to reduce this data imbalance through transparent disclosures (Philippe & Durand, 2011). Increased transparency is shown to reduce data asymmetries and empower stakeholders (Dhaliwal et al., 2014; Dingwerth & Eichinger, 2010; H bek & Wolniak, 2016). However, risk management efforts may clash with increased transparency; studies show a CSR reporting deficiency amongst companies, characterized by a hesitancy to report anti-corruption, environmental and social data (Kühn et al., 2014; Tamimi & Sebastianelli, 2017; Transparency International, 2009). Indeed, corporations appear to favour reporting beneficial information over harmful, despite the observation that disclosing negative data may enhance stakeholder trust (Hahn & Lülfs, 2013; Holder-Webb et al., 2008; Lougee & Wallace, 2008). Leadership teams worldwide struggle to resolve the conflict between securing stakeholder trust via legitimizing behaviour and managing risk. Simultaneously, stakeholder demand for transparency and wariness of the so-called greenwashing continues to increase. While this conflict is well documented, it cannot be resolved without an objective and consistent tool for measuring disclosure transparency. Our research seeks to create such a tool.
We are not aware of any research that has been done on developing a metric for transparency in CSR reports; however, two notable attempts have been made to measure transparency in other contexts. Rawlins (2008) used a survey-based exploratory model and determined that the transparency metric (T-metric) must be prepared from those stakeholders’ perspectives who do not control the data. The survey comprised 21 transparency-related traits, each rated on a 7-point scale. The trait-based nature of this metric results in an assessment of the quality of overall organizational transparency. The survey provides a valuable transparency profile for evaluating stakeholder groups’ perceptions. The second example is the HRV Index (HRV is the first letter of Hollyer, Rosendorff & Vreeland). This metric explored the transparency quality of aggregate economic data from 125 national governments (Hollyer et al., 2017). Data collected for the index include 240 transparency indicators derived from the World Bank’s World Development Indicators. The HRV Index differs from the Rawlins Survey because its criteria are highly objective. Further, the HRV Index treats transparency as a predictor of the presence or absence of data. We developed a T-metric derived from the stakeholder perspective of the Rawlins Survey and the transparency definition of the HRV Index to meet the need for a CSR T-metric. The new metric will facilitate the evaluation of company transparency and investigate the relationship between transparency and sustainability rankings.
Methodology
The quality of the ‘trustworthiness’ of a corporation is challenging to measure. Assuming that a trustworthy corporation is inherently honest, it must transparently disclose positive and negative CSR data more than an untrustworthy corporation. The T-metric developed for this research is designed to quantify the total number of negative disclosures in a CSR report.
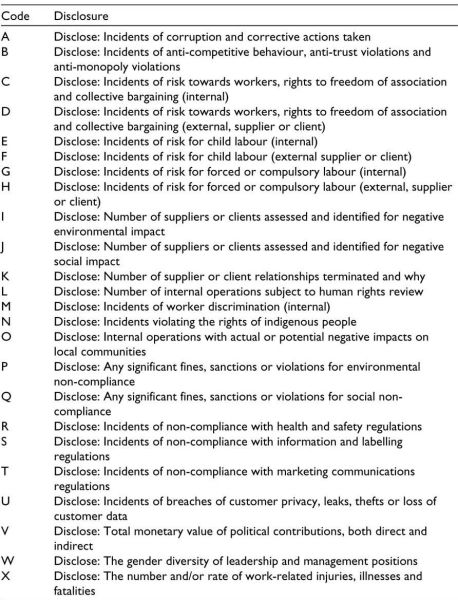
The T-metric comprises 24 disclosure categories derived from the GRI’s ‘comprehensive’ disclosures. Appendix A displays these 24 disclosure categories with their alphabetic reference codes. Each CSR report is investigated for the presence of disclosures for each category using the methodology of Hollyer et al., (2017). They asserted that transparency is predictive of the ‘presence or missingness’ of data. The quality of any disclosure that is present is also analysed. Scoring for each disclosure category is accomplished using the simplified matrix in Figure 1.
Figure 1. Scoring Model for T-metric.
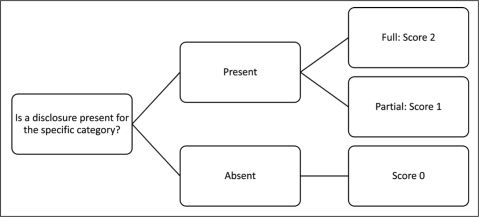
The score values indicate the extent of the availability of data. ‘Full’ means complete disclosures on topics with figures, data and/or incidents provided, where applicable, or disclosure that no incidents occurred during the reporting period. ‘Partial’ refers to topics indicating awareness of the issue but no specific disclosure. ‘Absent’ indicates a lack of any disclosure or topic acknowledgement. This simplified ‘Full’, ‘Partial’ and ‘Absent’ framework maintains an objective reading of disclosures. The scoring considers the inclusion of a category but not the quality or nature, that is, beneficial or harmful data, maintaining a stakeholder perspective (Rawlins, 2008). Therefore, publicly available CSR reports were used for the analyses. Disclosures not included within the primary CSR report are treated as 25% less significant (applying a 0.75 penalty) than an identical disclosure in the main report by the metric. Adjustments made were meant to penalize corporate obfuscation to distract stakeholders. Our approach assumes that data not presented in CSR reports are less visible and thus less significant from a stakeholder perspective.
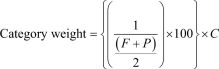
After scoring CSR reports, the new transparency ranking (T-ranking) was calculated by applying a weight to the raw t-values. Before weight calculations, each score was multiplied by 50 to achieve integer scores between 0 and 100. The weightage scheme was then applied to the new values (0, 100 or 500). The weightage system was used because less common disclosures are more valuable than common disclosures. For example, if 80% of reports disclose data for Category B, and only 10% disclose for Category R, then Category R scored higher than Category B. Equation 1 shows the calculations for category weight.
 (1)
(1)
Where, F = the number of full disclosures, P = the number of partial disclosures and C = 0.84. C is a constant that ensures all weights are equivalent to 100 and restores the traditional 0 to 100 scoring scale. The value of constant C has been derived from converting the total category weight (118) to 100, that is, C = 100/118 = 0.84. In other words, multiplying each weight by C makes the total weight 100. This weight ensures discrete T-ranking and provides a unique score for reports. The raw, weighted and unweighted t-values were then used for statistical analyses.
The t-value analysis was performed on the CSR reports of Corporate Knights’ (CK) 2021 Global 100 Most Sustainable Corporations in the World ranking (Corporate Knights, 2021). The data were collected from each listed company’s CSR (or equivalent) report. Each company was evaluated by CK based on 21 key performance indicators (KPIs), reflecting sustainable business practices divided amongst five categories: (a) Resource management (including energy, water, waste GHG and other pollutant emissions data), (b) financial management (including pay ratio, R&D, tax and supplier data), (c) employee management (including injury/fatality/turnover and gender equality data), (d) a measure of the total sanction deductions over the relevant reporting period and (e) a measure of revenue from clean sources.
Companies are not required to disclose all 21 KPIs. Only industry-specific KPIs, as per CK’s weighting system, are reported. However, companies are screened and removed from consideration for failing to meet the following three requirements: (a) Disclose at least 75% of the KPIs deemed relevant to their industry, (b) demonstrate a minimum level of financial strength, as determined by the Piotroski F-score (Piotroski, 2000) and (c) abstention from ‘sin’ industries or services that are counterproductive to sustainable development. Notably, demographic limitations to CK’s sampling will carry over to the data gathered from the T-metric. All analysed companies exhibit a minimum disclosure behaviour, and those experiencing financial instability and companies from ‘sin’ industries are excluded. Finally, each corporation was given a percentage score based on CK’s analysis of the relevant KPIs, which is used to establish the overall ranking.
When choosing a data source supporting the research goals, it was important to analyse a sample set of companies that had already been independently qualified as sustainable. While several other third-party rankings are available, such as the S&P Global Sustainability Yearbook and Barron’s Top Sustainable Companies list, ultimately, the CK list was selected based on the transparency and clarity of its published methodology. The CK’s data is general and collected from international corporations across all sectors.
In addition to the t-values, the statistical analysis of supplemental company characteristics (e.g., firm size, the usage of reporting standards and the reporting conditions of each corporation’s home nation) was included to help describe the T-S linkage. Microsoft Excel and R4.1.0 (R Core Team, 2021) software were used for analysis.
Results
After analysing each CSR report using the T-metric, the weighted t-values were used to compile an alternate T-ranking, displayed in Table 1. The distribution of changes in rank (Rank Δ) is normally distributed (Figure 2).
Table 1. Ranking Table.
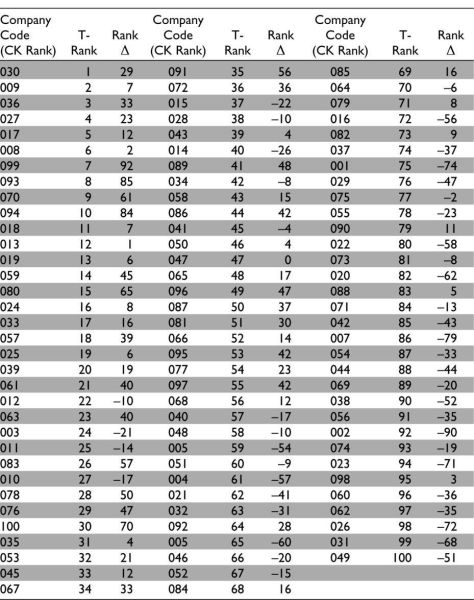
Figure 2. Rank Change Distribution (via weighted t-value).

The data did not show any correlation between T-rank and CK rank. The correlation between the CK percentage scores and the raw t-value (0.13), weighted t-value (0.12) and unweighted t-value (0.09) were slightly higher. However, a strong correlation between them remains elusive.
Three data sets were obtained from the T-metric report analysis: The raw t-value, the unweighted t-value (with penalties and score conversions but without the weight) and the weighted t-value (all penalties, conversions and calculations). Pearson Correlation Coefficient (PCC) analyses of these three datasets revealed a strong correlation amongst all three, and analysis of the distributions for the three values (Figure 3) provides further insight. All three data sets were normally distributed. The weighted and unweighted t-values did not exhibit a significant advantage over the raw scores in the analysis. The weighted t-value is the preferential dataset for establishing the T-ranking as it allows for discrete ranks. Eight non-repeating scores out of one hundred in raw t-value were observed, making it inefficient to establish consecutive ranks. However, PCC and distribution analysis revealed that all three are similar to the raw t-value. Therefore, raw t-values were used for further analyses.
Figure 3. Weighted, Unweighted and Raw t-value Distribution.

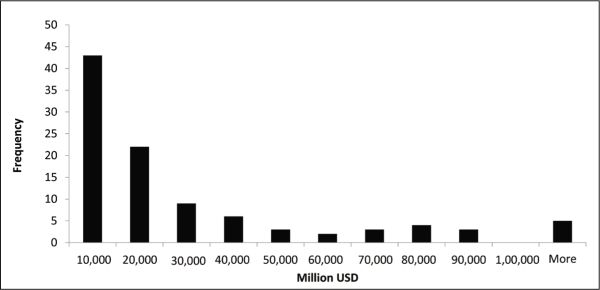
Variable analysis was performed to identify statistically significant relationships that may predict the raw t-value. Two variables from each CSR report were analysed: Total equity and mandatory/voluntary reporting. Total equity (in millions of USD) is used to estimate the total financial value of the company. This data was mined from each reporter’s financial filings and confirmed on the Wall Street Journal’s market analysis site (WSJ, 2021). The distribution of equity amongst the companies is given in Figure 4. Firm value, across all samples, is clustered under 2 billion USD and 65% of all reporters fall under this category. Firm value is limited by the financial screenings of the original CK sample set.
Figure 4. Equity Distribution of the Data Set.
Regression analysis of total equity and raw t-value reveals an absence of any significant relationship, as visualized in Figure 5. An analysis of variance (ANOVA) test confirms this with a p value calculated at 0.805 (Table 2). There is no observable relationship between the firm value and their level of transparency in this sampling. PCC analysis of both equity and firm size seems to confirm this. The correlations for these two values are 0.032 and –0.087, respectively, indicating very little correlation (a PCC of 0.0 indicates no correlation). However, the limitations of the sample size and the equity distribution preclude this research from making concrete observations regarding the relationship between these two variables and t-values.
Figure 5. Equity/Raw t-value Scatterplot.
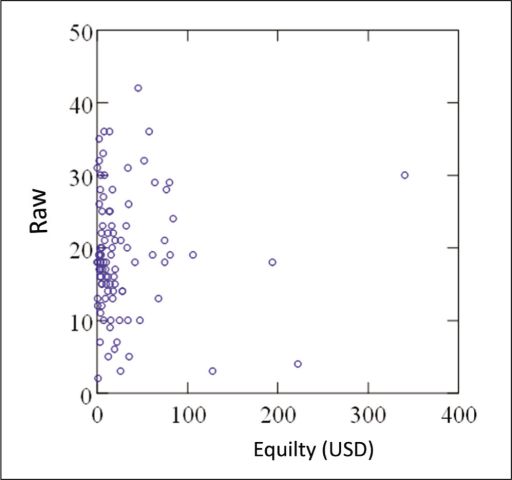
Table 2. ANOVA of Equity/Raw and Mandatory-Voluntary/Raw.
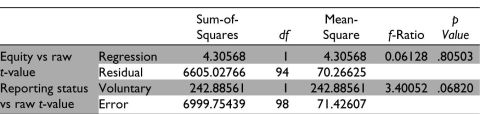
ANOVA analysis of the variable mandatory/voluntary status (Table 2) suggests a relationship between the raw t-values and legal reporting status. However, the data falls short of establishing a statistical relationship (p value of .06820). The mean raw t-value for mandatory reports is 22.33, whereas the voluntary reports achieve a mean of 18.68. Mandatory reporters appear to have a transparency advantage over voluntary reporters within the sample population.
Discussion
In relation to our first objective, the T-metric is an appropriate and effective metric that objectively measures the transparency of a CSR report. As a simple metric based on the objective presence or absence of specific disclosure categories (assuming that transparency tends to provide unaltered and honest data), T-metric accomplishes this measurement, at least amongst the disclosure categories. However, the disclosure categories evaluated (Appendix A) are by no means total or complete. The list could easily be expanded to include more disclosures or refined to suit the needs of the specific sample demographic.
A key and obvious criticism of these disclosures is their direct derivation from the GRI standard. A reasonable observer would be expected to see a bias towards GRI reporters within the t-value data; however, the ubiquitous use of the GRI standard amongst the reports sampled somewhat clouds this issue. 67% of the reports in the source data (CK Ranking) utilize GRI standards in some respect. With the entire sample demographic being biased towards this variable, a similar bias in the T-metric seems unavoidable. Future research may modify the metric to distance it from this bias. However, this may prove not easy in practice, considering the GRI’s growing presence as the industry standard for sustainability reporting. The GRI’s list of disclosures has been developed over several years and continues to grow, expanding its scope and applicability. A disclosure-based T-metric developed independently will likely overlap in its content with the GRI through no fault of the researchers. Similar to the HRV Index’s reliance on the World Bank indicators, any metric designed to value the transparency of disclosures objectively must establish specific criteria to analyse (Hollyer et al., 2017). Establishing criteria uniquely distinguishable from those determined by existing monitoring firms i.e., GRI, Sustainability Accounting Standards Board (SASB) or World Bank may not be a realistically achievable goal. Further work is required to determine whether a similar bias is avoidable.
Further limitations to the T-metric results concern the sample set itself: the CK Ranking list. The ‘Result’ section describes financial and industry-specific screening of potential CK Ranking candidates, eliminating firms that do not pass these criteria. Such samples are, by extension, eliminated from consideration in this research. However, this limitation is somewhat required during this exploratory work, as the t-value data must be compared to samples of a known sustainability value. These sample limitations leave several lines of future research involving applying this metric to these other subject groups. Other researchers have indicated that industry categories are incredibly significant when understanding CSR, as different industries may have different stakeholder groups (Sturdivant & Ginter, 1977; Sweeney & Coughlan, 2008). Limiting future research to specific industries and adapting the stakeholder considerations and disclosure profiles of the T-metric in response would provide beneficial insight into industry-specific understandings of transparency.
The implications of T-metric’s objective disclosure analysis are for future exploration. T-metric considers the quality of the disclosure only insofar as it applies to whether the data/information is provided. T-metric does not consider the moral nature of the disclosure (whether it is ‘good’ or ‘bad’). Carrying this fact forward into a thought experiment, it is conceivable that an objectively unsustainable company (i.e., from a ‘sin’ industry) could provide enough transparent data in its CSR report to score similarly to, or even higher than, a company considered objectively sustainable (vis-à-vis CK rankings or similar). Thus, it is essential to establish that the T-metric measures only the honesty of the subjects’ disclosures; the disclosure content is not important for the metric and could be objectively negative or positive. The observation that an unsustainable company could be considered transparent may seem outwardly perverse but illustrates a consequential facet of the T-S linkage. This observation suggests that transparency in and of itself is not a guarantor of sustainability. A stakeholder perspective must, therefore, accept that increased transparency serves to balance data asymmetries; it is the quality and nature of the data that informs sustainability performance. For management teams focusing on legitimization in good faith, this observation makes a strong argument for prioritizing transparency to support subsequent sustainability efforts. Future research should expand the sample demographic to include companies outside the sustainability elite and further explore this facet of the T-S linkage.
The t-value of the 100 companies in the CK G100 list was analysed. Each report was analysed for the 24 disclosure categories and scored according to the data quality. The weighting system described in the ‘Methodology’ section proved statistically unnecessary for data analysis. However, it served its primary function of providing discrete, non-repeating ranks. The data analysis provided significant insights into the raw t-values and firm value (equity) relationships. A corporation’s equity does not seem to correlate with t-value, somewhat counterintuitively suggesting that an organization’s financial worth and size do not affect its disclosure transparency. This observation stands in stark contrast to previous studies that large corporations, with more resources and increased public/governmental scrutiny, are more likely to implement CSR (Boesso & Kumar, 2007; Mittal et al., 2008; Tamimi & Sebastianelli, 2017; Ting, 2021). Amongst larger companies, CSR is approached from a risk management perspective rather than as a transparent communication strategy. Illustrative of the conflict between the risk perspective and stakeholder perspective, this lack of correlation may signal to stakeholders that a certain amount of scepticism towards CSR efforts is not unfounded. If CSR, when practised by the largest and wealthiest firms, is ultimately used in a risk management capacity, the stakeholder’s need for data symmetry is sidelined. Additionally, the finding that larger companies are not necessarily correlated with increased transparency (rather than CSR implementation, generally) is perhaps a reflection of potential greenwashing tendencies from larger companies. Increased pressures on corporate legitimacy may drive transparency down despite data showing that transparency creates value and lowers risk (Francis et al., 2009; Hahn & Lülfs, 2013; Pigors & Rockenbach, 2016). This indicates that, generally, management teams taking legitimate risk management steps need to balance them with transparency efforts if sustainability is a genuine goal. Notably, financial screenings the sample set underwent during the CK selection and the left-skewed equity distribution in Figure 4 may be biasing this observation, at least regarding equity. These limitations and the lack of any observable correlation between firm equity/size and transparency prevent this research from making actionable observations. Further analysis and study of more financially diverse companies is required to conclude the relationship between equity, organization size and transparency.
The relationship between reporting status (mandatory or voluntary) and transparency remains inconclusive. As previously stated, mandatory reporting requirements exist in many forms, although depend on too many variables to be included in this research. The calculated p value and the mean scores for each category suggest a relationship favouring mandatory reporters and increased transparency, but further work would be required to describe such a relationship entirely. The general mean t-value data from the mandatory/voluntary reporters seem to support observations that mandatory reporters have more transparent disclosure profiles in parallel with the position of Ghoogassian (2015), Moneva et al., (2006) and Hess (2012) in support of CSR regulation. However, the broad spectrum of CSR regulations makes concrete conclusions inappropriate here. Future research into classifying and categorizing regulatory strategies, their strengths and weaknesses and their overall effectiveness seems necessary to attest that mandatory reports are more transparent.
A deep and critical data analysis was done to find if the most sustainable companies share the most transparent data. At first glance, the poor correlation and normalized Rank Δ distribution observed in the ranking data do not bode well for a clear description of the T-S linkage. In a counterintuitive twist, sustainability, as a measurable value vis-à-vis the CK methodology, does not appear to predict or correlate with transparency, as measured by the T-metric. An initial observer may reasonably expect the most sustainable companies to be the most transparent, but this intuition is not seen in these data. However, upon more critical analysis and consideration of the corporate use of CSR as a risk management tool, the corporate metering of data flow, and the hypothetical ‘transparently unsustainable’ company, the reasoning behind this paradox becomes more apparent. A sustainability ranking, with data sourced from CSR reports, will not correlate with a measure of transparency because the data used is filtered through and controlled by corporate risk management strategy. The lack of correlation can be ascribed to the data asymmetries that corporations curate. CSR as risk management may create a reporting climate unfavourable to high levels of transparency, which confirms what others have seen regarding CSR reporting behaviour (Kühn et al., 2014; Tamimi & Sebastianelli, 2017; Transparency International, 2009).
Transparency and moral quality are disconnected when analysing T-metric; however, it is a measure of disclosure honesty. This seems a contradiction, as it has already been established that honesty is a moral quality used by stakeholders to evaluate the ‘goodness’ or, perhaps, ‘worthiness’ of a company. T-metric is used as a measure of moral honesty but not a moral measure of the content of disclosures, and the moral quality of an honest statement should be considered separate from the moral quality of what is reported.
From the lack of correlation and the T-metric observations, we contend that appearing sustainable (i.e., one’s sustainability ranking) does not depend on transparency. Likewise, the transparently unsustainable company’s thought experiment establishes that transparency does not depend on sustainability. Logically, there should be a connection between transparent disclosures (i.e., honesty) and sustainability, but a correlation is not observed here. We infer that this observation can be, in part, ascribed to the conflict that arises when CSR risk management and stakeholder demands for transparency clash.
Discussion on sustainability must be separated into two parts that we label apparent sustainability (AS) and true sustainability (TS). AS is determined by the data disclosures in CSR reports, the third-party rankings established by them and the company’s social presence. TS is determined by the unfiltered and uncensored CSR data, whose dissemination and access are controlled by the corporation that generates it. The corporation controls both AS and TS. However, their conflicting roles are critical to understanding the T-S linkage. AS is the sustainability value an organization displays to the public; it is shaped and informed by the corporation’s risk management strategy and therefore, is susceptible to manipulation and/or greenwashing, intentional or otherwise. TS is the sustainability value that stakeholder groups demand and arguably need to make accurate valuations of corporate behaviour, purchasing decisions and policy changes. The corporation’s chosen level of transparency determines the difference between AS and TS. At maximum transparency, the AS would theoretically be equal to the TS. In this way, TS depends on transparency, while AS does not. The lack of correlation seen by the T-metric is a symptom of AS. CSR reports and sustainability rankings are representations of AS, which is independent of transparency. Therefore, no correlation is observed. The T-metric, then, serves as an estimator of TS. An estimation of TS represented by t-values since, theoretically speaking, corporate control of TS prevents its value from ever being fully known by stakeholders. For the same reason, this observation is quite challenging to test. However, it remains a critical theoretical step in understanding the T-S linkage.
From a management perspective, if sustainability and social responsibility are a goal to be reached in good faith, the observations of the T-metric and our understanding of the T-S linkage suggest that CSR risk management must be tempered and balanced with transparency. Management teams should strive to make their AS equivalent to their TS or as close as reasonably possible. Risk management and stakeholder communication must be cooperative, not mutually exclusive.
Stakeholder groups are shown to have the power to influence corporate choices, including disclosure behaviour. Increased stakeholder pressures can directly improve the transparency of CSR reports (Fernandez-Feijoo et al., 2013). Demanding transparency, however, will require having an acceptable and accurate understanding of the TS of a company. Unfortunately, this can only be estimated via T-metric or stakeholders’ independent research without contentious CSR regulation. Having an easily digestible and reasonably accurate t-value for a company is critically important, representing a snapshot of its transparency profile. Considering this, T-metric shows significant potential as a possible valuation tool for TS. If developed into a complete measuring system, the T-metric could supplement CSR reports and give a more precise and accurate estimation of a company’s TS.
Conclusion
The success of the cooperative effort that is sustainable development and CSR depends on honesty and transparency. Individuals and corporations must communicate clearly to be effective at sustainable change and identify flaws and shortcomings transparently. Determining the disclosure transparency of corporations is a critical goal of stakeholders. However, stakeholders are disadvantaged amidst an asymmetric data environment that favours the corporation. The transparency–sustainability linkage remains obfuscated by self-reported data and corporate greenwashing. The findings of this research illustrate a disconnect between CSR and sustainability driven by the conflict between corporate risk management and transparency. Consumers, investors, government agencies and communities depend on data transparency to make informed purchasing, investment and policy decisions. Likewise, management teams need to balance transparency and risk to achieve legitimacy. The solution is a T-metric that can provide reasonably accurate external evaluations of corporate transparency.
Based on the observations of the T-metric data and the resultant intuitions of the T-S linkage, we can make the following conclusions. (a) Data asymmetries in CSR disclosures favour corporate risk management to the detriment of stakeholders. A robust objective and broad spectrum T-metric is critically important to empower stakeholders. Reduced financial and investment risk, accurate corporate valuation and responsible consumer habits depend on the understanding of transparency that this metric provides. This research provides a prototype for such a T-metric. (b) Management teams determined to improve and communicate sustainability performance must make room for increased transparency within their risk management strategy. Though our T-metric takes a stakeholder perspective, management teams could also use it internally to gauge the types of disclosures most important to their stakeholders and supplement existing risk management frameworks. More significantly, though, the T-metric developed for this article shows a somewhat disconcerting, but not surprising upon critical analysis, absence of any correlation between sustainability and transparency. This work concludes that sustainability determined by self-reported data cannot accurately predict or assume the reporter’s transparency. The AS proffered by CSR reports is not moderated by the corporation’s transparency and does not reflect it. This article makes the inference that the TS of a company, which is determined objectively by all the CSR data of a corporation, must be intrinsically and directly linked to transparency. Greater transparency will increase stakeholder awareness of TS and improve AS by extension. This observation also suggests, rather significantly, that TS can never be fully known as it would require complete transparency, an unlikely and potentially illegal corporate position.
CSR has become an increasingly popular management strategy amongst the world’s largest and most competitive companies amid an increased stakeholder focus on corporate sustainability and citizenship. Effective CSR depends on clear and transparent communication between the organization and its stakeholders. However, the frequently asymmetric nature of this relationship empowers the organization with nearly complete discretionary control over what data stakeholder groups have. This has led many to be sceptical, if not dismissive, of CSR activities and has justifiably led others to treat CSR reporting as nothing more than public image fluff pieces and outright deception at worst. With effective regulatory control of non-financial reporting considered rather far on the horizon, surrounded by a politicized labyrinth of lobbyists and interest groups, stakeholders are left with few tools to determine corporations’ trustworthiness accurately. Reporting standards, such as the GRI, attempt to solve this problem. However, their voluntary nature has failed to overcome the power asymmetry. Like CK, independent ranking organizations provide a valuable service to stakeholders and investors by assessing and listing the most sustainable corporations. However, their reliance on self-reported data leaves the fatal asymmetry intact. Building stakeholder trust with honesty and data transparency remains the elusive lynchpin for effective CSR.
Acknowledgment
Ricardo Calderon thanks Professors Steve Dunn, John Skalbeck and Gregory Mayer for the direction, advice and support they provided for this research.
Declaration of Conflicting Interests
The authors declared no potential conflicts of interest with respect to the research, authorship and/or publication of this article.
Funding
The authors received no financial support for the research, authorship and/or publication of this article.
ORCID iD
Amulya Gurtu https://orcid.org/0000-0003-3149-8668
Appendix A. T-metric Disclosure Categories.
Boesso, G., & Kumar, K. (2007). Drivers of corporate voluntary disclosure. Accounting, Auditing & Accountability Journal, 20(2), 269–296. https://doi.org/10.1108/09513570710741028
Burke, L., & Logsdon, J. M. (1996). How corporate social responsibility pays off. Long Range Planning, 29(4), 495–502.
Chen, L., Feldmann, A., & Tang, O. (2015). The relationship between disclosures of corporate social performance and financial performance: Evidences from GRI reports in manufacturing industry. International Journal of Production Economics, 170, 445–456. https://doi.org/10.1016/j.ijpe.2015.04.004
Corporate Knights. (2020). 2020 global 100 ranking. https://www.corporateknights.com/rankings/global-100-rankings/2020-global-100-rankings/2020-global-100-ranking/
Corporate Knights. (2021). About us. https://www.corporateknights.com/about-us/
Deegan, C. (2002). Introduction. Accounting, Auditing & Accountability Journal, 15(3), 282–311. https://doi.org/10.1108/09513570210435852
Dhaliwal, D., Li, O. Z., Tsang, A., & Yang, Y. G. (2014). Corporate social responsibility disclosure and the cost of equity capital: The roles of stakeholder orientation and financial transparency. Journal of Accounting and Public Policy, 33(4), 328–355. https://doi.org/10.1016/j.jaccpubpol.2014.04.006
Dingwerth, K., & Eichinger, M. (2010). Tamed transparency: How information disclosure under the global reporting initiative fails to empower. Global Environmental Politics, 10, 74–96.
Dye, R. (1985). Disclosure of nonproprietary information. Journal of Accounting Research, 23(1), 123–145.
Fernandez-Feijoo, B., Romero, S., & Ruiz, S. (2013). Effect of stakeholders’ pressure on transparency of sustainability reports within the GRI framework. Journal of Business Ethics, 122(1), 53–63. https://doi.org/10.1007/s10551-013-1748-5
Francis, J. R., Huang, S., Khurana, I. K., & Pereira, R. (2009). Does corporate transparency contribute to efficient resource allocation? Journal of Accounting Research, 47(4), 943–989. https://doi.org/10.1111/j.1475-679X.2009.00340.x
Ghoogassian, C. (2015). Evading the transparency tragedy: The legal enforcement of corporate sustainability reporting. Hastings Business Law Journal, 11(2), 361–384.
Gurtu, A., Saxena, R., & Sah, N. (2019). Offshoring decisions: A comprehensive & conceptual framework. Operations and Supply Chain Management, 12(3), 118–128. https://doi.org/10.31387/oscm0380236
H?bek, P., & Wolniak, R. (2016). Relationship between management practices and quality of CSR reports. Procedia - Social and Behavioral Sciences, 220, 115–123. https://doi.org/10.1016/j.sbspro.2016.05.475
Hahn, R., & Lülfs, R. (2013). Legitimizing negative aspects in GRI-oriented sustainability reporting: A qualitative analysis of corporate disclosure strategies. Journal of Business Ethics, 123(3), 401–420. https://doi.org/10.1007/s10551-013-1801-4
Hess, D. (2012). Combating corruption through corporate transparency: Using enforcement discretion to improve disclosure. Minnesota Journal of International Law, 21, 42–70.
Holder-Webb, L., Cohen, J. R., Nath, L., & Wood, D. (2008). The supply of corporate social responsibility disclosures among U.S. firms. Journal of Business Ethics, 84(4), 497–527. https://doi.org/10.1007/s10551-008-9721-4
Hollyer, J. R., Rosendorff, B. P., & Vreeland, J. R. (2017). Measuring transparency. Political Analysis, 22(4), 413–434. https://doi.org/10.1093/pan/mpu001
Husted, B. W. (2005). Risk management, real options, corporate social responsibility. Journal of Business Ethics, 60(2), 175–183. https://doi.org/10.1007/s10551-005-3777-1
Kronthal-Sacco, R., & Whelan, T. (2019). Sustainable share index: Research on IRI purchasing data (2013–2018). NYU. https://www.stern.nyu.edu/sites/default/files/assets/documents/NYUSternCSB_SustainableShareIndex_2019.pdf
Kühn, A.-L., Stiglbauer, M., & Heel, J. (2014). Does mandatory CSR reporting lead to higher CSR transparency? The case of France. Corporate Ownership and Control, 11(2), 29–45. https://doi.org/10.22495/cocv11i2p3
Kytle, B., & Ruggie, J. G. (2005). Corporate social responsibility as risk management: A model for multinationals. Harvard University.
Loh, L., Thomas, T., & Wang, Y. (2017). Sustainability reporting and firm value: Evidence from Singapore-listed companies. Sustainability, 9(11), 2112. https://doi.org/10.3390/su9112112
Lougee, B., & Wallace, J. (2008). The corporate social responsibility (CSR) trend. Journal of Applied Corporate Finance, 20(1), 96–108. https://doi.org/10.1111/j.1745-6622.2008.00172.x
Mittal, R. K., Sinha, N., & Singh, A. (2008). An analysis of linkage between economic value added and corporate social responsibility. Management Decision, 46(9), 1437–1443. https://doi.org/10.1108/00251740810912037
Moneva, J. M., Archel, P., & Correa, C. (2006). GRI and the camouflaging of corporate unsustainability. Accounting Forum, 30(2), 121–137. https://doi.org/https://doi.org/10.1016/j.accfor.2006.02.001
Nielsen, N. V. (2015). The sustainability imperative. NIQ. https://nielseniq.com/global/en/insights/analysis/2015/the-sustainability-imperative-2/
O’Connor, A., & Meister, M. (2008). Corporate social responsibility attribute rankings. Public Relations Review, 34(1), 49–50. https://doi.org/10.1016/j.pubrev.2007.11.004
Orlitzky, M., Schmidt, F. L., & Rynes, S. L. (2003). Corporate social and financial performance: A meta-analysis. Organization Studies, 24(3), 403–441.
Philippe, D., & Durand, R. (2011). The impact of norm-conforming behaviors on firm reputation. Strategic Management Journal, 32(9), 969–993. https://doi.org/10.1002/smj.919
Pigors, M., & Rockenbach, B. (2016). The competitive advantage of honesty. European Economic Review, 89, 407–424. https://doi.org/10.1016/j.euroecorev.2016.09.001
Piotroski, J. D. (2000). Value investing: The use of historical financial statement information to separate winners from losers. Journal of Accounting Research, 38, 1–41.
Rawlins, B. (2008). Give the emperor a mirror: Toward developing a stakeholder measurement of organizational transparency. Journal of Public Relations Research, 21(1), 71–99. https://doi.org/10.1080/10627260802153421
S&P Global. (2020). Measuring intangibles: The SAM corporate assessment methodology. https://portal.csa.spglobal.com/survey/documents/DJSI_CSA_Measuring_Intangibles.pdf
Shnayder, L., van Rijnsoever, F. J., & Hekkert, M. P. (2015). Putting your money where your mouth is: Why sustainability reporting based on the triple bottom line can be misleading. PLoS One, 10(3), e0119036. https://doi.org/10.1371/journal.pone.0119036
Sturdivant, F. D., & Ginter, J. L. (1977). Corporate social responsiveness. California Management Review, 19(3), 30–39. https://doi.org/10.2307/41164709
Suchman, M. C. (1995). Managing legitimacy: Strategic and institutional approaches. Academy of Management Review, 20(3), 571–610. https://doi.org/10.2307/258788
Sweeney, L., & Coughlan, J. (2008). Do different industries report corporate social responsibility differently? An investigation through the lens of stakeholder theory. Journal of Marketing Communications, 14(2), 113–124. https://doi.org/10.1080/13527260701856657
Swift, T. (2001). Trust, reputation and corporate accountability to stakeholders. Business Ethics: A European Review, 10(1), 16–26. https://doi.org/10.1111/1467-8608.00208
Tamimi, N., & Sebastianelli, R. (2017). Transparency among S&P 500 companies: An analysis of ESG disclosure scores. Management Decision, 55(8), 1660–1680. https://doi.org/10.1108/md-01-2017-0018
Threlfall, R., King, A., & Shulman, J. (2020). The time has come - The KPMG survey of sustainability reporting 2020. KPMG. https://home.kpmg/xx/en/home/insights/2020/11/the-time-has-come-survey-of-sustainability-reporting.html
Timothy Coombs, W., Golob, U., & Holladay, S. J. (2013). The pseudo-panopticon: The illusion created by CSR-related transparency and the internet. Corporate Communications: An International Journal, 18(2), 212–227. https://doi.org/10.1108/13563281311319490
Ting, P.-H. (2021). Do large firms just talk corporate social responsibility? - The evidence from CSR report disclosure. Finance Research Letters, 38, 101476. https://doi.org/10.1016/j.frl.2020.101476
Transparency International. (2009). Transparency in reporting on anti-corruption: A report on corporate practices. https://www.transparency.org/en/publications/transparency-in-reporting-on-anti-corruption-a-report-on-corporate-practice
Verrecchia, R. E. (1983). Discretionary disclosure. Journal of Accounting and Economics, 5, 179–194. https://doi.org/10.1016/0165-4101(83)90011-3
Webley, S., & More, E. (2003). Does business ethics pay?: Ethics and financial performance. Institute of Business Ethics. https://books.google.com/books?id=2QYLPQAACAAJ
WSJ. (2021). Market Data. https://www.wsj.com/market-data
